Feature
Quote comparison
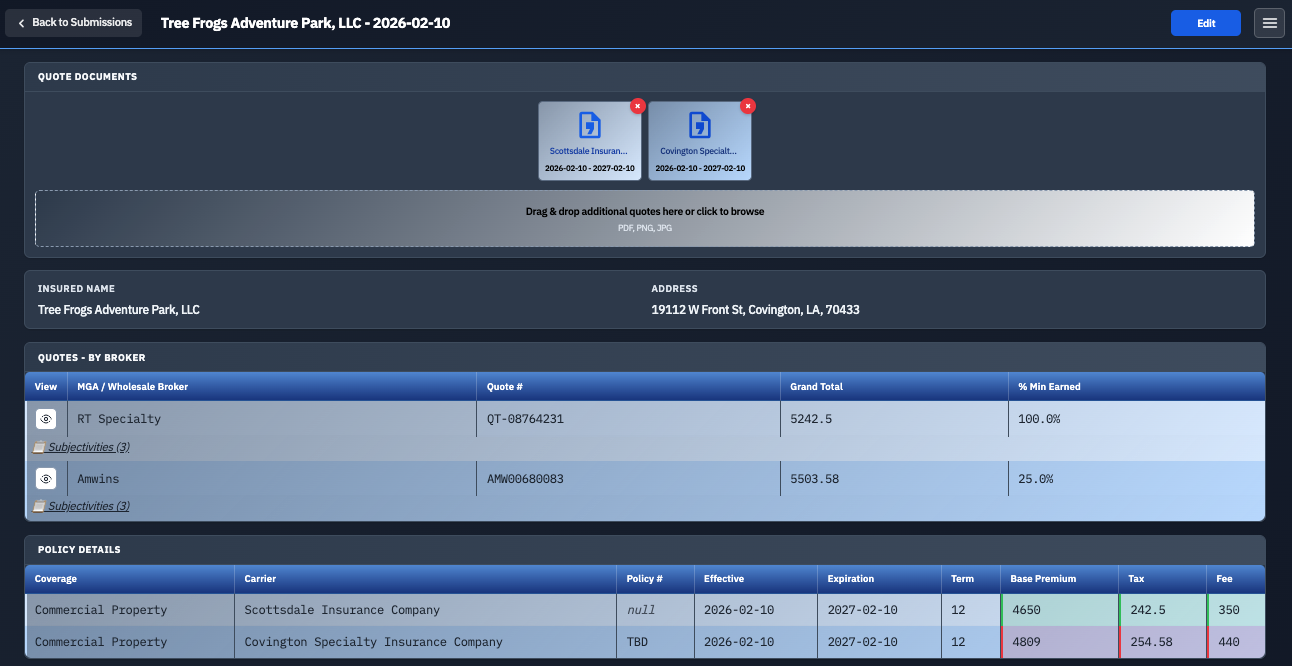
Line up quotes across carriers side by side, with threshold-based highlighting so the meaningful differences in premium, limits, and terms jump out — instead of building a comparison spreadsheet by hand.
The problem it solves
Comparing surplus lines quotes means far more than finding the lowest premium. You're weighing limits, sublimits, retentions, exclusions, and terms across markets that all present them differently — one quote buries the retention in fine print while another states it up front, and the same coverage goes by three different names across three carriers. Done by hand, comparison means rebuilding a spreadsheet for every submission, retyping figures out of each PDF, and hoping you didn't miss the one exclusion that guts the coverage the client actually needs.
That manual process is slow, but the real danger is accuracy. A comparison built on a mistyped limit or an overlooked sublimit leads to the wrong recommendation — and in surplus lines, the cheapest number on the page is frequently not the best deal once retention and exclusions are accounted for.
How it works
Once quotes are captured and parsed, they populate a comparison view automatically — no manual spreadsheet. You set thresholds for the fields that matter, and the view highlights where quotes diverge beyond them, so your eye goes straight to what's different rather than scanning a grid of near-identical numbers.
- Side-by-side layout across every quote on a submission, one row per field, one column per carrier.
- Threshold highlighting flags meaningful gaps in premium, retention, or sublimits automatically.
- Beyond premium — compare limits, retentions, exclusions, and terms, not just price.
- Fed by parsing — the data comes straight from PDF quote parsing, so you compare what the carrier sent, not a hand-copied version.
What to compare — and why a grid helps
A sound comparison weighs the whole package: coverage limits and sublimits, deductibles and retentions, endorsements and exclusions, effective dates and terms, carrier financial strength, and the all-in cost including surplus lines taxes and fees. Laid out in a consistent grid, differences that are invisible when flipping between PDFs become obvious — two quotes with identical premiums and top-line limits can look equivalent until the sublimits sit side by side. For a deeper treatment of the evaluation itself, see how to compare surplus lines quotes across carriers.
Why it matters
Faster, more thorough comparison means better placement decisions and a clearer story for the insured — without the spreadsheet busywork. It also makes the comparison consistent: every submission is evaluated against the same criteria, so the quality of the recommendation doesn't depend on who built the spreadsheet or how much time they had. That consistency is what lets an agency defend a placement decision later and hand accounts between team members without losing rigor.
Frequently asked questions
What should you compare beyond premium?
Limits and sublimits, deductibles and retentions, endorsements and exclusions, dates and terms, carrier and wholesaler details, and the all-in cost with fees and taxes. A lower premium can cost more overall once retention or a key exclusion is factored in.
How does threshold-based highlighting work?
You set thresholds for the fields that matter, and the view highlights where quotes diverge beyond them, so meaningful gaps stand out instead of hiding in a wall of numbers.
Do I have to enter the quote data to compare it?
No. Quotes captured through inbox monitoring and PDF parsing populate the comparison automatically, so you compare the figures the carrier actually sent.
Compare your own quotes
Bring quotes from a few markets and we'll line them up live. 20 minutes, no pressure.
Request a Demo